
Measuring the impact of social media
A critical part of social media marketing, like all of digital marketing, is measuring the impact your online efforts make to your bottom line and brand equity. Each social media platform has its own unique set of metrics, along with some universal metrics such as impressions that can be tracked across all platforms. These platforms have also evolved to have comprehensive analytics dashboards that can be easily accessed to monitor statistics. So, let’s start tracking.
Facebook Analytics
Of all the social media platforms, Facebook offers the most comprehensive analytics that can be viewed on your page’s ‘insights’ section, as well as be externally downloaded. Within the overview section of the insights, you can view data on actions taken on the page, page views, page previews, page likes, post reach, post engagements and much more.
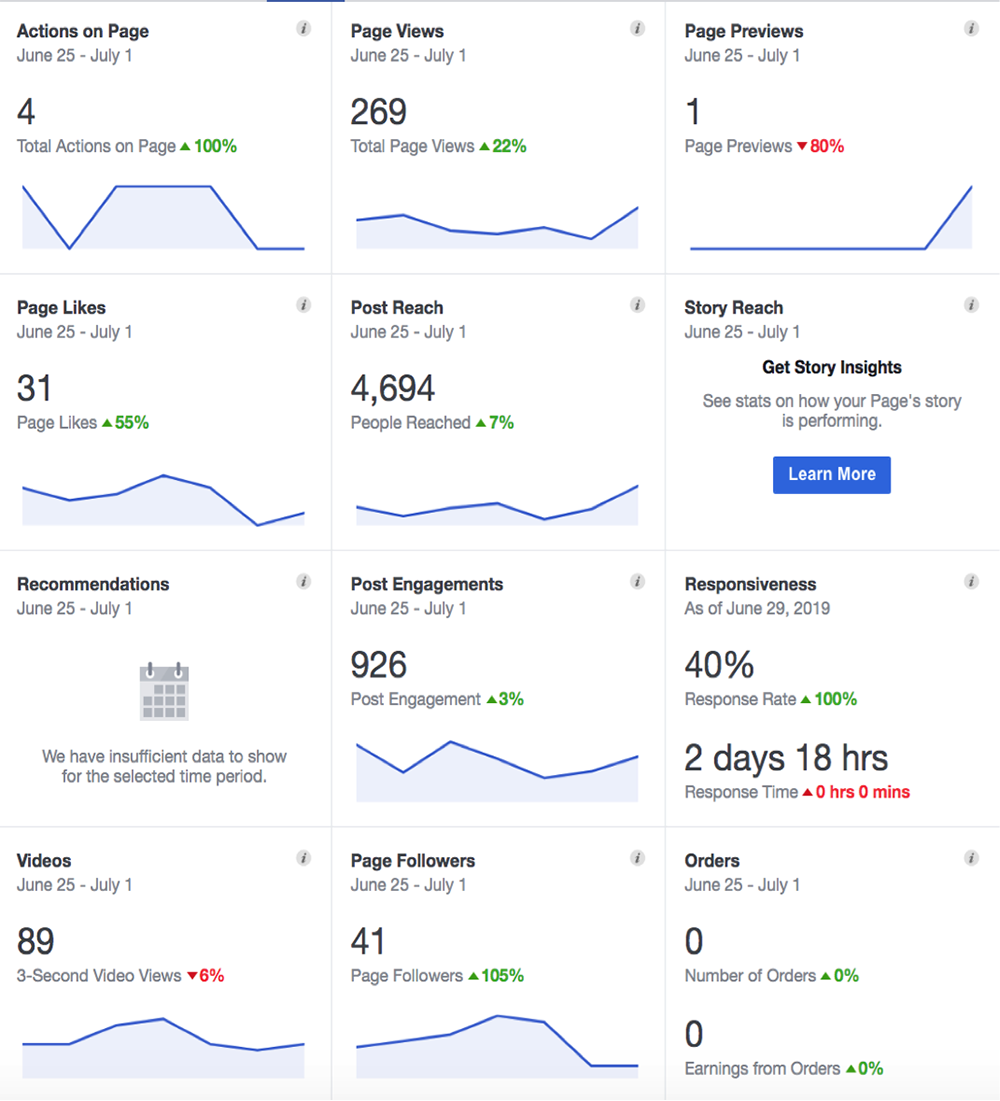
The top-level and priority metrics to keep an eye on include page views, post reach and post engagements. These three define how your brand is performing on Facebook to reach new customers and to retain the attention of existing and potential customers towards your messaging.
- Page views are the total number of times people have visited your page and actively made an effort to explore your brand online.
- Post reach is the number of times people saw your posts on their Facebook timeline. This can be organic or paid and is broken down accordingly.
- Post engagements are the number of times people have engaged with your posts through likes, comments, shares and clicking. This helps you identify if the posts you are putting out there are interesting to your followers.
The ‘insights’ section on your Facebook page also has other useful metrics that can further assist your business. Under the ‘posts’ tab in your ‘insights’ section, you can view useful information that will help you plan your posts and campaigns for maximum ROI and engagement. For example, one graph demonstrates when is the best time for a brand to post. Is it 9pm with over 20,000 reachable users on Facebook vs 3pm with only 5,000? Similarly, is Tuesday the optimum day to post according to the available data of reachable customers or is it Friday? You can now have such a granular level of detail.
The ‘posts’ tab also gives you information on how each post on your Facebook page performed based on the reach and engagement it received. This insight can be beneficial in critically evaluating your content strategy and altering it to enhance brand performance online.
Similarly, under the ‘people’ tab, you can view the demographics of the people who follow your page and who you most often reach to alter content further to increase engagement and relevance. You can now check if your fans are millennials from metropolitan cities or baby boomers from the country, therefore, altering the brand messaging to appeal to them.
Twitter Analytics
While Twitter analytics aren’t as comprehensive as the ones available on Facebook, you can still obtain several useful social media metrics from the platform’s analytical dashboard that are worth tracking. These are shown to you as 28-day summaries.
As a snapshot, the platform provides you data on the number of tweets delivered by your brand, the tweet impressions they earned, the visits your brand profile received, the number of mentions your brand received and the difference in the number of followers you have month on month.
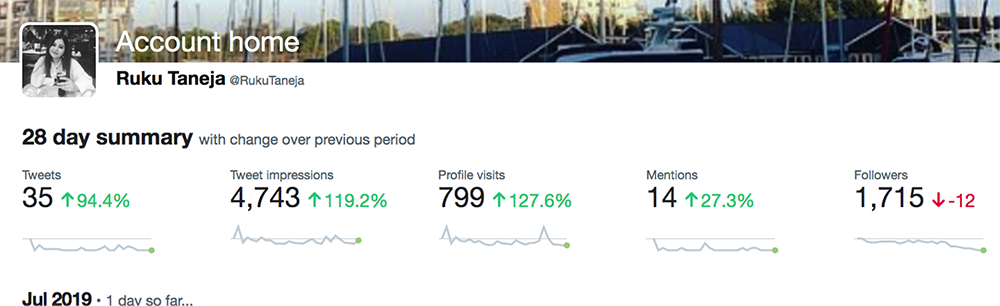
All of the above provide a clear picture of your success each month on the social media platform. For example, an increase in tweet impressions (the number of people who have seen your tweets) and profile visits (the number of people who have visited your brand profile), provides an indication that the brand is attracting new and existing customers to its messaging with quality content and an increased frequency of tweeting. The number of followers your brand has on its Twitter profile and the number of mentions (times its username has been mentioned and used by others), showcases its popularity and market positioning online when compared to competitors.
Additionally, Twitter also provides you with your top tweets and mentions so that you know the type of content that engages your followers and the influential followers you should engage with. You can click on any tweet on this screen to see more detailed metrics.
Speaking of engagement, Twitter has exact metrics on engagement worth tracking. It gives a brand their engagement rate on the platform (the number of total link clicks, retweets, favourites and mentions, divided by the impressions), to provide an understanding of if the brand messaging is resonating with customers to take action and move along the sales journey. The higher the engagement rate, the better – and an engagement rate of 0.5% to 1% are considered healthy.
Similar to Facebook, Twitter also has demographics data on your audience worth measuring. Under the ‘audience’ tab in your analytics, this includes interests your followers have, languages they speak, locations they are from and mobile phone type and carrier connections they have. These can all be used to create
customer archetypes to market to.
They can also be clicked on individually to expand the information available further. For example, you can see the interests a set of followers has. Are they interested in science news, or do they care about dogs? Or both? How many are male or female? Which cities do they come from?
Instagram Analytics
Analytics on Instagram are divided into three categories: data on the activity on your profile, data on the content you are posting and data on your followers or audience. Unlike Facebook and Twitter, however, Instagram does not offer monthly comparison data but offers weekly comparisons instead.
In the ‘activity’ section of your analytics, analysing the ‘interactions’ your Instagram profile has had is key. These set of insights measure the actions people take when they engage with your brand online. For example, if your business has a marketing goal of receiving more leads through your social media posts, then measuring increases in interactions for website clicks and calls will be critical. Similarly, if your goal is brand awareness, then the interaction of more profile visits will be noteworthy.
Brand awareness can also be measured by the ‘discovery’ analytics under the ‘activity’ tab. These set of insights measure how many people see your content and where they find it. For example, a brand can give a reach of 500, which is the number of unique accounts that have seen posts from them. It can also have 1,000 impressions; the total number of times their posts have been seen that week.
Under the ‘content’ tab of insights, you can see how the content on your feed performed weekly. Posts are ordered by the number of impressions; the number of times they were seen. This can help give your brand get an idea of how well your content is doing and can be used to determine which types of posts connect with your target audience the best. This section also contains the same kinds of insights for any stories or ads you run on the platform.
If you tap on a particular post on your feed, you can also get further detailed insights that might be useful when measuring a campaign post’s impact on the overall performance of the brand on Instagram. For example, you can see how many interactions a brand received from a post and how many times it was discovered by unique accounts because of that particular post. We can now attribute success and data to specific campaign posts and measure their impact on the overall standing of the brand.
Furthermore, like Facebook and Twitter, Instagram also provides you data on the demographics of your followers under the ‘audience’ tab. This includes the following:
- Total number of followers you have
- Followers gender ratio and age ratio
- Regions your followers are from
Again, this can help in creating relevant messaging for your followers to increase your interactions.
Google Analytics for social media
While all the social media platforms have several common and unique metrics worth tracking, such as impressions, engagement, interactions and demographics, the real impact of your social media marketing can also be measured by the traffic metrics available on the Google Analytics of your website.
Once you go into the ‘acquisition’ tab of your analytics, you can see the default channels by Google that include ‘social’ traffic and how it is impacting your website. For example, the brand below received 63.6% of its traffic from social media. We are now able to easily measure the amount of social media traffic coming in, the time it’s spending on the site and the influence it is having on the business.
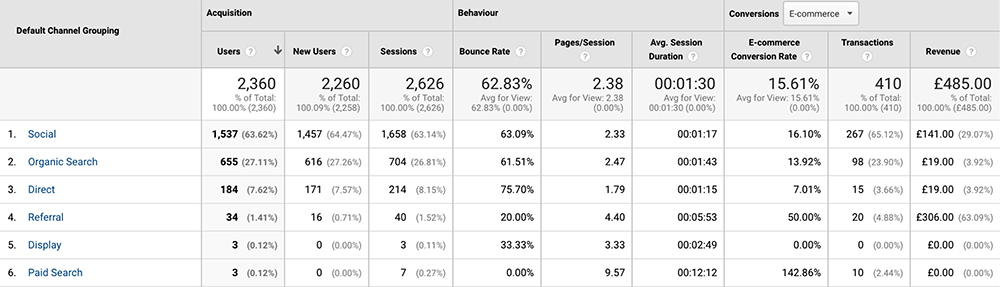
You can further measure the social traffic by each platform when you click into the ‘social’ tab. With this depth of understanding, you can easily identify the top traffic acquisition medium, the behaviour of the traffic from each medium and their effect on the business goals of a website. For example, YouTube seems to be the most useful medium of traffic for this brand’s e-commerce goals.
In conclusion, analysing your social media performance metrics and statistics is now easier than ever. What’s, perhaps, more important, is to identify which metrics genuinely reflect your business goals and consolidating the data into actionable marketing reports. This is where an agency can step in, define your goals and track relevant performance against it. If you’d like to know more or to discuss how we can help, please contact our team on hello@banburyhoward.co.uk.